
By Karan Mehra | PRM Digital | Reviewed 13 October 2026
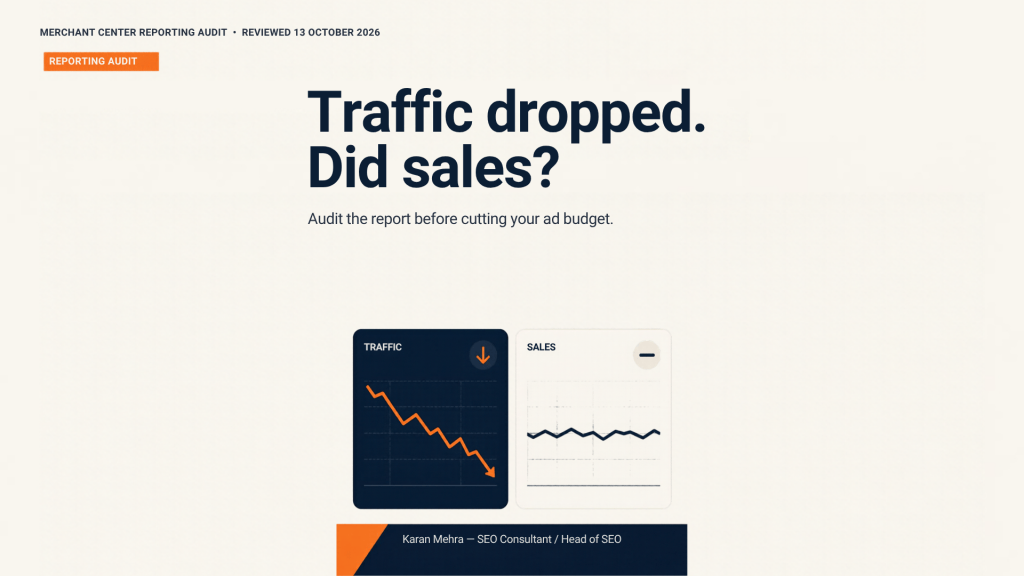
A falling traffic line can trigger an expensive response: cut the campaign, rewrite the feed, replace the agency. Before making that decision, establish whether customer behaviour changed or the report started counting something differently.
That distinction matters for retailers using Merchant Center alongside Google Ads, YouTube Shopping and an ecommerce order system. Each report answers a different question. Combining their totals without checking definitions can turn a measurement adjustment into an unnecessary commercial intervention.
This is an implementation audit, not breaking news. Google’s Merchant Center announcement is dated 11 August 2026 and describes changes beginning 24 August. The framework below is my recommended operating process for checking an affected account; it is not a Google-prescribed checklist or a claim about your store’s performance.
What the Merchant Center announcement says
Google describes four changes: separating commission-eligible YouTube affiliate activity from Organic, aligning YouTube organic interaction definitions, expanding advertising product reporting, and introducing a future Network dimension. The two YouTube changes can reduce reported Organic traffic and restate history from 1 July 2026. The advertising expansion can increase reported metrics. Google limits the stated historical restatement to the two YouTube changes. The notice still describes Merchant Center’s Network dimension as a future capability; verify availability in your account.
Source: Merchant Center performance reporting updates.
These reporting movements are reasons to investigate, not proof that every decline is harmless. A retailer can experience a definition change and a genuine loss of sales during the same period. Diagnose both possibilities before explaining the result to a client.
Product reporting has its own counting rules
Google’s separate product reporting documentation describes an expansion beginning in June 2026. Keep that date distinct from the Merchant Center notice. It also distinguishes direct product clicks from clicks on other ad elements. One ad featuring several products can generate several product impressions. A click on a general ad element can be recorded against each included product.
Consequently, adding product rows need not reproduce the number of ad impressions or unique visitor actions. Google also distinguishes account-level product reporting for Shopping and Performance Max from campaign-level access for Video, App and Demand Gen. Inspect the selected view before assuming a missing campaign has no activity.
The practical rule is to attach a definition to each metric. A number called “clicks” is incomplete until its report, scope and interaction type are known.
Start with three evidence layers
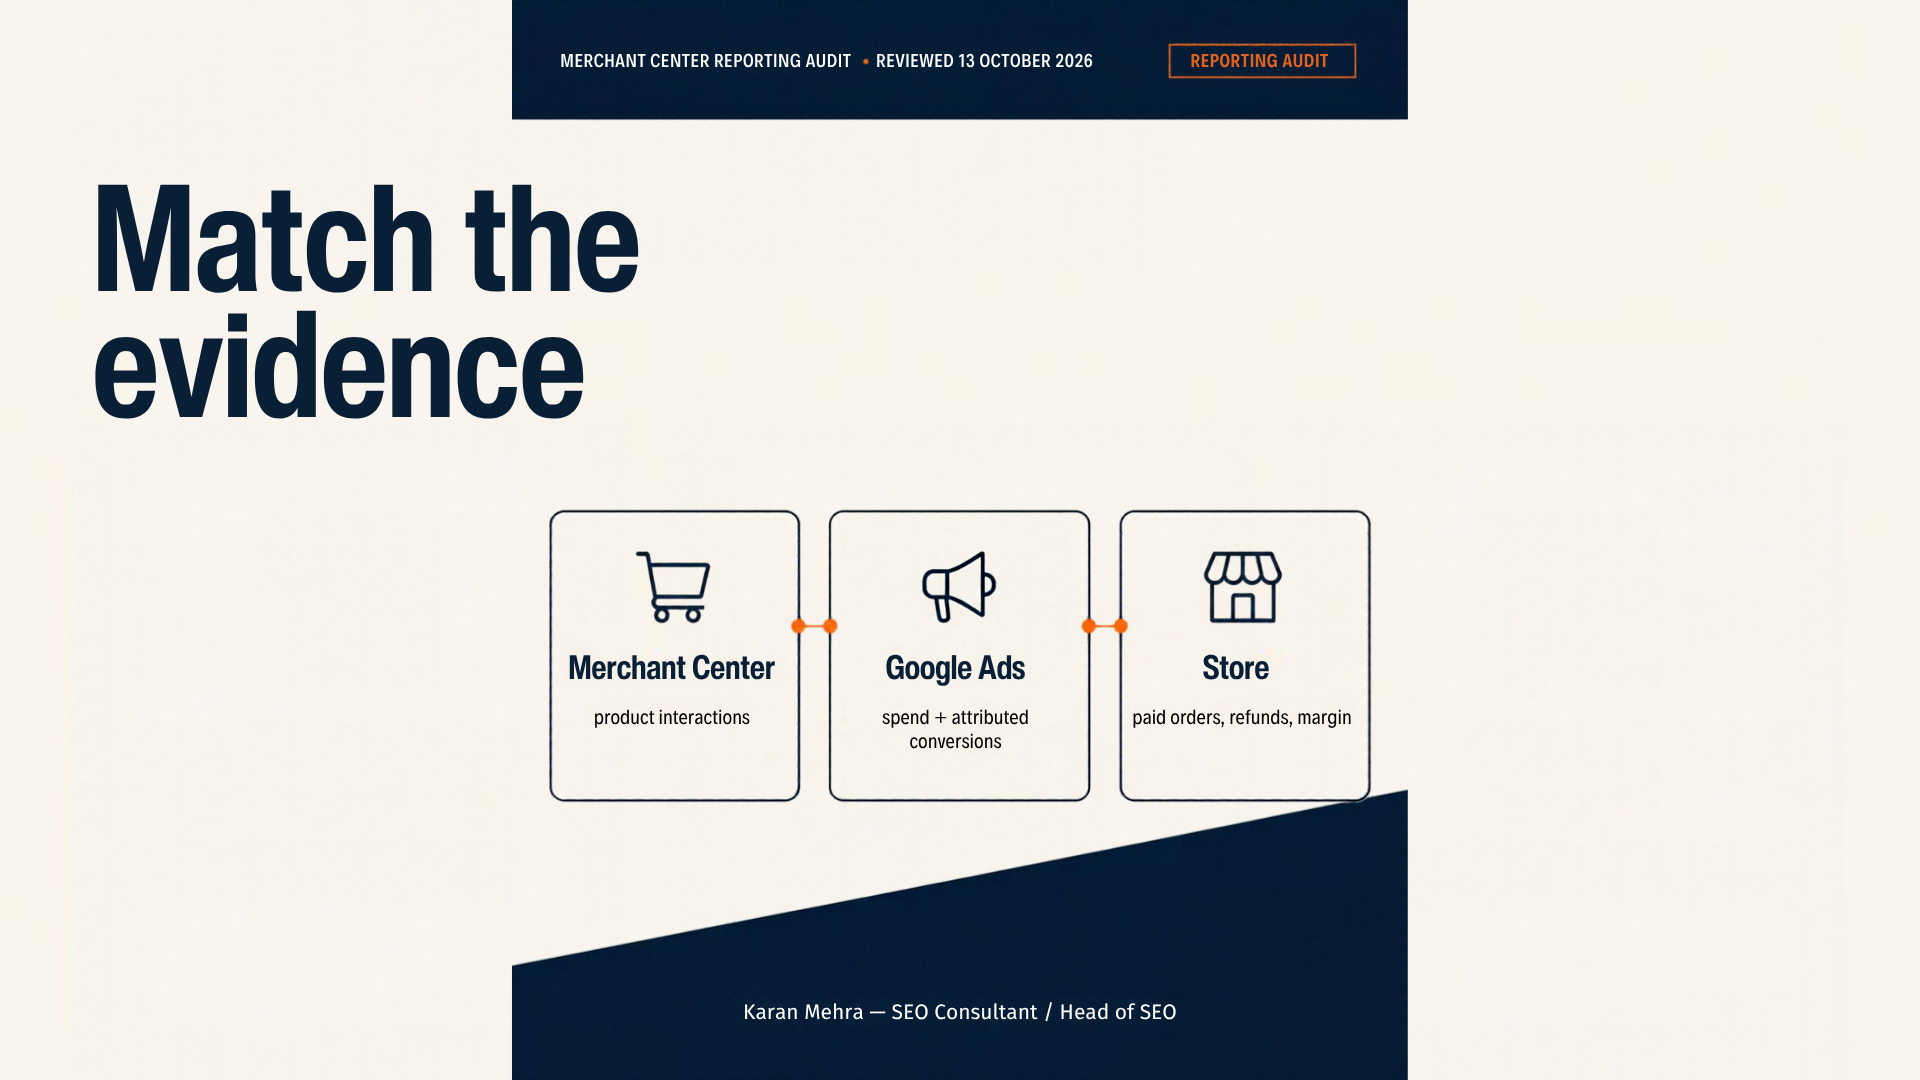
Use the following routing table to decide which system should support each claim. This is an audit framework, not a promise that the systems will reconcile perfectly.
| Evidence layer | Question it answers | Useful checks | What it cannot establish alone |
|---|---|---|---|
| Merchant Center | How did product interactions change? | Traffic classification, product eligibility, comparable report scope | Incremental sales or profit |
| Google Ads | What did advertising spend and attributed outcomes do? | Cost, conversion action, attribution settings, campaign coverage | All store sales or causal lift |
| Store order system | What did customers buy and retain? | Paid orders, cancellations, refunds, net revenue, item margin | Which advertising interaction deserves credit |
For an ecommerce business, the commercial question should lead. If paid orders and net revenue are stable while only a channel label moves, investigate classification first. If orders decline too, continue into stock, delivery, demand and checkout diagnostics. Neither pattern proves causality by itself.
Need a coordinated review of advertising, product data and your website? Discuss your ecommerce growth workflow with PRM Digital.
A five-stage reporting audit
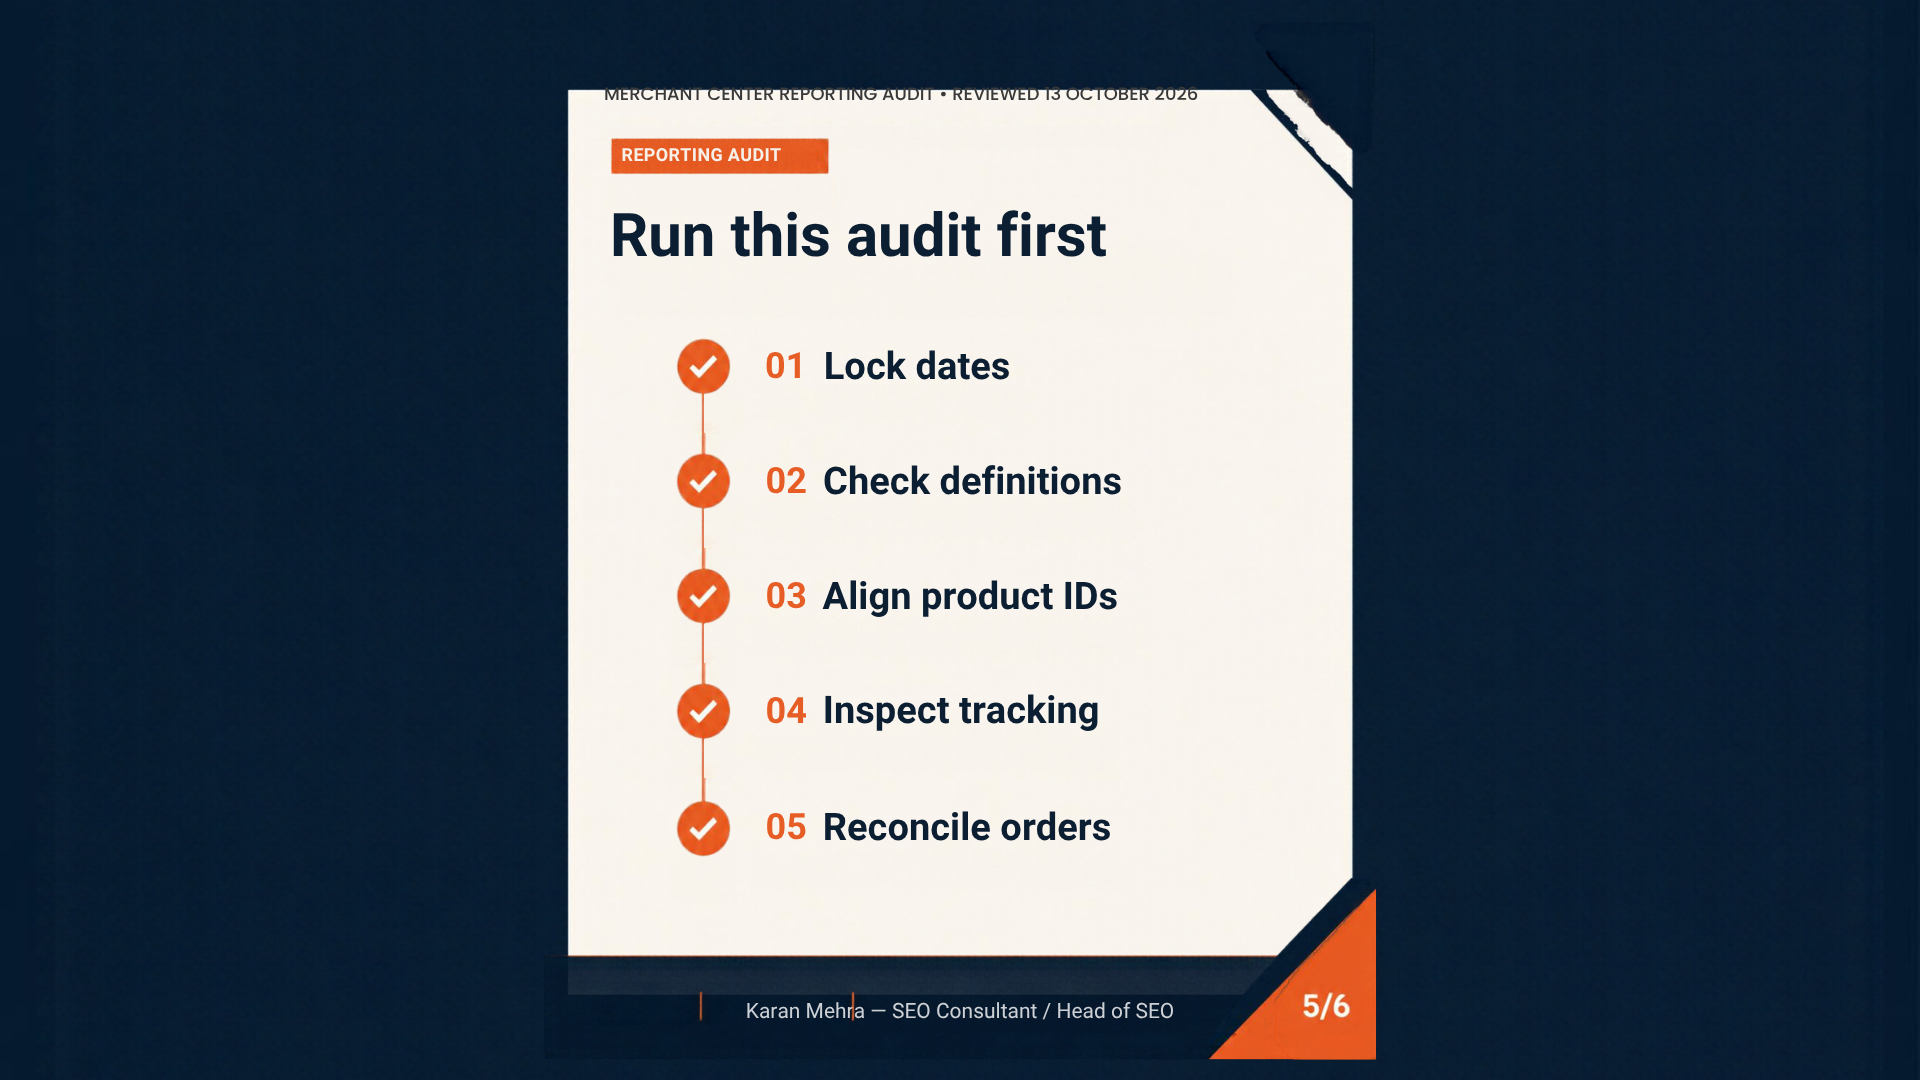
1. Lock the comparison before investigating
Record the exact start and end dates, account timezone, currency and report filters. Compare equivalent weekday mixes where practical. Avoid treating today’s incomplete results as directly comparable with a fully processed prior day.
Keep separate views for the historical reporting transition and the current trading period. An October sales decline should not automatically be attributed to an August definition change. Ask when the visible break first occurred and whether the current dashboard was rebuilt recently.
Save the original export, the refreshed export and a short explanation of the difference. An earlier client PDF may preserve a previous definition. It is a historical record, not automatically a mistake; label the methodology before replacing its figures.
2. Build a metric dictionary
Create one row for every metric used in the management report. Include source, report view, traffic category, unit, attribution basis, date basis and owner. Add a note for whether it is a unique event, an attributed outcome or a product-level count.
For example, “organic product interactions in Merchant Center” and “organic sessions in GA4” should occupy different rows. Do not overwrite both with a generic Organic Traffic label. Likewise, separate spend from product-level interaction counts and backend revenue from advertising-attributed conversion value.
This dictionary need not become a large documentation project. Start with the ten metrics that actually trigger decisions. If an automated alert uses a metric nobody can define, disable that alert’s budget-changing action until its meaning is clear.
3. Align products and report scope
Choose a small group of commercially important products: a reliable seller, a seasonal item, a recently changed item and an item with an eligibility issue. Map feed identifiers to the store’s product and variant identifiers. Record whether the export is at parent-product, variant, campaign or account level.
Check stock and eligibility separately from reporting definitions. A disapproved product can lose delivery even when the account’s total rises through broader reporting coverage. Aggregate growth can hide a problem in the item that produces the most useful margin.
When joining product tables, verify that the mapping does not multiply rows. A product appearing in several campaigns is not several different products. Inspect the join key and aggregate at the intended level before calculating totals.
Want help identifying the first mismatch? Send the report names and affected date range on WhatsApp: +91 98036 18014.
4. Inspect conversion measurement
Google’s data discrepancy guidance identifies reporting delay, tag configuration and attribution settings as possible causes of mismatched data. It also recommends conversion-time columns when comparing reports that use different date bases.
Check which purchase action is included in your performance report and which actions influence bidding. Look for duplicated purchase collection, missing transaction identifiers, incorrect values or currency, and recent consent or checkout changes. Verify the configuration before editing it; several conversion actions can exist legitimately for different purposes.
Use a controlled test purchase only with the store owner’s authorization and a defined refund or test-order process. Observe whether the purchase reaches the intended systems with the expected identifier and value. A successful page load alone does not demonstrate a successful purchase event.
Document remaining discrepancies instead of forcing equality. An attributed conversion and a paid backend order are not interchangeable records. The goal is an explained difference with a responsible owner, not a spreadsheet that happens to show matching totals.
5. Reconcile commercial outcomes
Build an aggregate weekly table containing advertising spend, paid orders, cancelled orders, refunds, net revenue and the store’s chosen margin measure. Record the treatment of tax, shipping and returns. Compare that commercial table with the platform trend, using consistent periods.
Keep YouTube affiliate analysis aggregated. Google’s affiliate analytics guidance notes that some transaction metrics include pending and approved activity and can change. It also prohibits using the supplied analytics to identify viewers or combining datasets to build granular individual profiles. Product- or period-level operational comparisons do not require that kind of profiling.
For stores accepting cash on delivery, separate placed orders from paid or fulfilled orders according to your finance process. A rise in submitted orders can coexist with more cancellations. The report should show the outcome used to judge the business, with the definition written beside it.
An illustrative diagnosis
Imagine a retailer whose refreshed dashboard shows lower Organic activity and higher advertising product interactions. Its store ledger shows broadly stable paid orders. This example is hypothetical; no client results are implied.
The analyst first checks classification and report coverage. They compare equivalent products and periods, then examine conversion settings. If those checks explain the change, the correct deliverable is a revised baseline and a methodology note. Changing the budget to correct a reclassified traffic line would address the report’s appearance rather than a demonstrated trading problem.
Now change one detail: paid orders fall and important products become unavailable. The same reporting adjustment still exists, but it cannot explain the commercial decline by itself. The priority moves to inventory, eligibility and customer experience. This is why “it is only a reporting change” should remain a conclusion supported by evidence, never a default response.
If your search visibility and paid-media reporting are being reviewed separately, ask PRM Digital to connect the analysis.
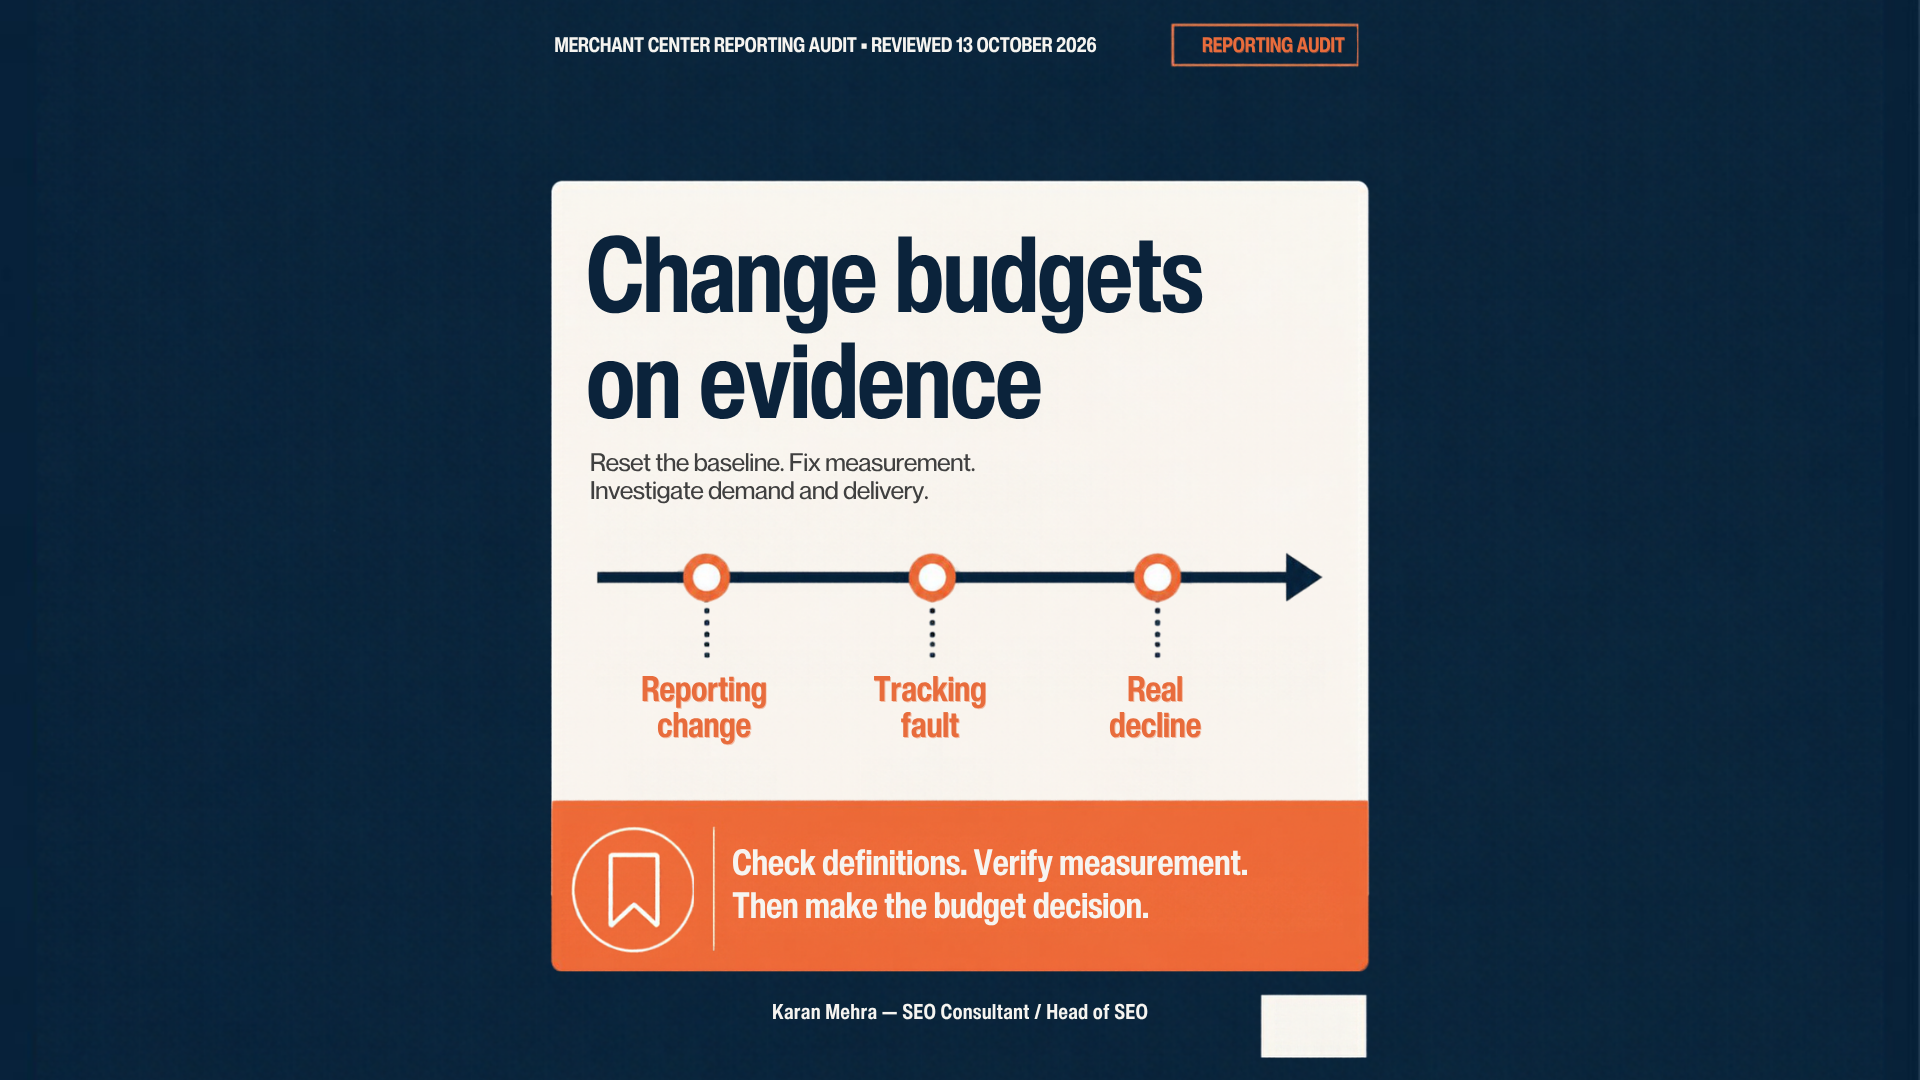
Turn the finding into a budget decision
| Diagnosis | Evidence to retain | Recommended next action |
|---|---|---|
| Definition or coverage change | Comparable exports and a documented scope difference | Annotate the break and establish a comparable baseline |
| Measurement fault | Reproducible missing or duplicated events | Repair tracking and verify collection before trusting efficiency metrics |
| Genuine commercial decline | Consistent deterioration in business outcomes | Investigate demand, eligibility, stock, landing pages and checkout |
| Mixed or unresolved causes | Conflicting evidence and assigned investigation owners | Make bounded decisions with explicit uncertainty and review dates |
Set materiality according to the store’s economics and typical volatility. There is no universal percentage that proves a tracking fault or justifies a budget cut. Low-volume campaigns can change sharply after one order; higher-volume accounts may support a more stable comparison.
Do not freeze all commercial decisions indefinitely. If stock is unavailable or a verified checkout fault is wasting spend, act on that concrete evidence. If only the metric definition changed, update the report rather than manufacture a campaign problem.
Before your next budget review, discuss the unresolved evidence on WhatsApp: +91 98036 18014.
A practical seven-day implementation plan
Day one: appoint a reporting owner and collect exports with their filters. Day two: complete the metric dictionary and annotate the known transition. Day three: map the priority products and inspect eligibility. Day four: review conversion actions and recent tracking changes. Day five: reconcile aggregate orders, returns and revenue with finance. Day six: rewrite alerts and client notes around comparable metrics. Day seven: approve the diagnosis, assign any remaining fixes and record the budget decision.
This is a suggested sequence, not an official deadline. Compress it when the evidence is straightforward; extend technical diagnosis when it is not. Each stage should produce a reviewable record instead of another unsupported dashboard opinion.
Frequently asked questions
Does a Merchant Center Organic drop prove that SEO failed?
No. Check the metric definition, product mix and relevant business outcomes. A reporting change can affect the displayed total, while a separate visibility problem may also exist.
Should I add every product row to reproduce campaign totals?
Not without understanding the counting rules. Product-level visibility and interactions can be credited across several items shown together. Inspect the relevant metric definition and aggregation level.
Can historical client reports change?
Refreshed data can differ from earlier exports after a restatement. Preserve the previous record and document which definition and extraction date each version used.
Is Merchant Center’s Network segmentation live everywhere?
Do not assume that. The announcement describes it as a future capability. Verify your current account interface and documentation before promising a specific segmentation view.
What should I send for an initial audit?
Start with report names, date ranges, metric definitions and an aggregate description of the mismatch. Avoid sending customer personal data unnecessarily.
For a focused review, contact Karan Mehra on WhatsApp: +91 98036 18014.
The useful outcome is a defensible explanation: what changed, which evidence supports it, and what action follows. That explanation should come before a budget decision based on a single traffic line.


Leave a Reply